Time, Verbosity and the Other Axes
DeepSWE already published wall-clock per task, so I had it plotted. What the time axis shows, why Gemini 3.8 Flash breaks every other family's shape, the columns I would want after cost, performance and time, and Real-SWE putting time on the board from private company code.
I ended Counting Agent Turns with a request. Three numbers describe a coding agent: cost, performance, and time. Leaderboards print cost and performance - some even print turns - but I wanted time printed beside them.
The other columns describe parts of those three numbers without replacing them. Output tokens and agent steps speak to performance: how much context a run burns, how verbose the model is, how many tool calls it needed. They also feed cost, which has to be measured per task. A step count or referencing tokens-per-second can approximate time (as some benchmarks do), and DeepSWE's toggle for count and clean visualization of differences was the closest thing I had to my ideal data visualization. But steps is a proxy and still wasn't the actual data point I was looking for.
I roughly outlined the thought in the #ai-news channel on Kagi's Discord. Then I realized: surely someone has thought of this. Someone had, and had opened an issue on DeepSWE's GitHub in July asking for total time per task, and a reply a few days later found that the answer was already sitting in the site's own HTML (!). For every model and effort configuration, the public leaderboard JSON has two fields: median_duration_seconds and mean_duration_seconds. The page draws cost, tokens and steps from that file, and duration is in the same rows but never appears in a chart.
That left one fetch and one plot to add. I wrote the spec and had Claude and Codex build it: a single HTML file that reads the official JSON and simply plots pass rate against each metric: time, cost, output tokens and steps with a Pareto frontier for each. It lives at deepswe-time.pages.dev. There is a description of what it does in the write-up.
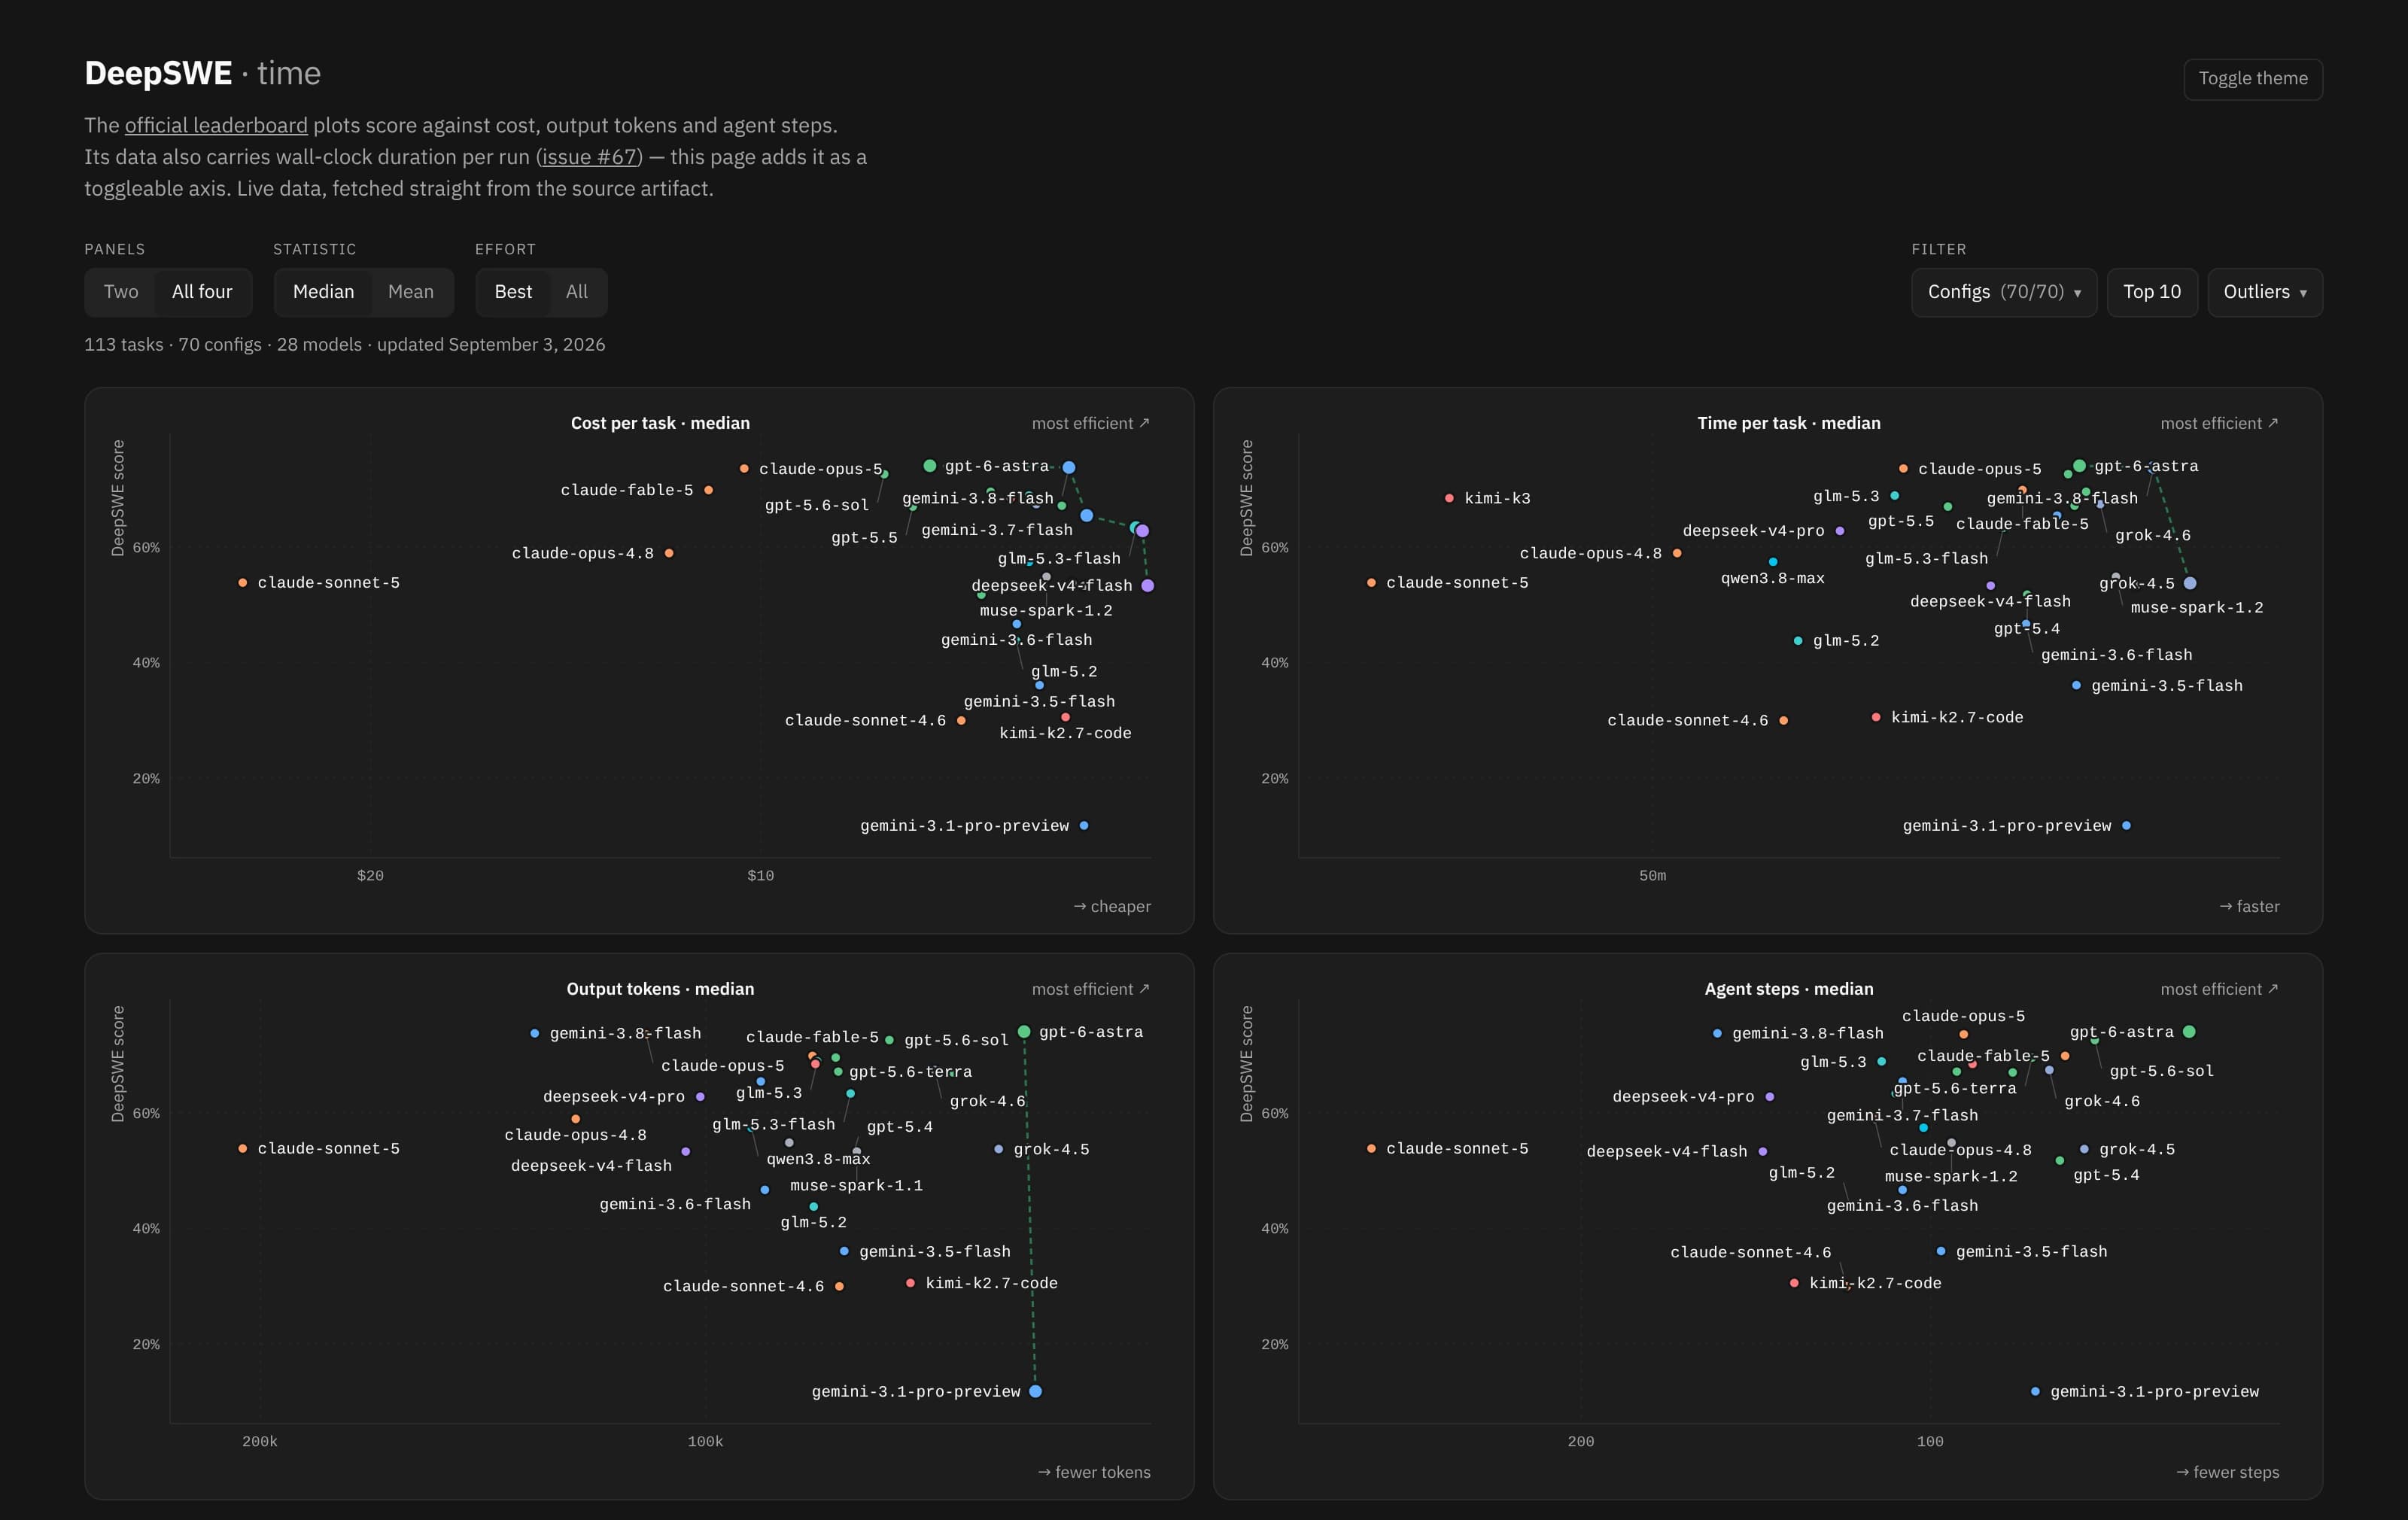
I had assumed in my earlier post that steps is a rough approximation for time. The chart clearly shows they are not. As of the September update, Gemini 3.8 Flash and Claude Opus 5 share a score. Opus median task gets to the finish line in 91 steps at a total of ~30 minutes, but Flash (as the name implies) shuffles its tiny legs a whopping 161 steps to finish in ~10 minutes. Opus got there in fewer steps but took three times as long! The wall-clock shows the truth and the thinking time between tool calls that the step count cannot.
Flash also breaks the shape every other family follows in more ways than one. Flash's medium and high effort levels score near the top on pass rate at roughly a third of the cost of the models beside them. If you read these points alone, it almost seems like a foregone conclusion: Gemini is in the lead right? It scores at the top, it finishes first, and it costs 1/3 of the price for the same performance! But there's more to the story: Gemini 3.8 at high effort takes a median of 166 steps and emits 138k output tokens per task and its peak context runs past 200k tokens, whereas its tie-runner GPT-6 Astra, uses only a fraction of that at 29 steps and 29k output tokens.
That is five times the tool calls and five times the output for the same result: that is incredible verbosity. Hidden within those metrics is accelerated context-rot and cache saturation, both of which will make your work more costly down the line. For these reasons Gemini 3.8 Flash fits certain usage well: it is cheap, fast, and capable, but it may degrade over long-horizon tasks with compounding verbosity, context-rot, successive runs etc. Therefore I think for one-off / one-shot tasks where verbosity is less detrimental, Gemini is the tool to reach for. For long-horizon work, where every step builds upon the next, or spends context you cannot get back, it is the wrong trade.
However IndyDevDan, in a benchmark rundown on his YouTube channel appraises these results and reads the same rows differently. He uses Flash as a workhorse for long runs since it hits a seemingly nice balance of cost / time / performance efficiency. Maybe this will work well as he says, the data in DeepSWE alone supports either read. But if you read my other blog posts verbosity and token inefficiency can compound to real issues and be a silent killer.
Times also vary widely at scores lower on the board. Two configs score 54%, but one has a median of seven minutes per task, and the other an hour and twelve minutes! Cost per task might tell you which you can afford, but time per task tells you how long you can bear to wait, and whether you will still have your original context when it finishes.
Cost, performance and time are the 3 main metrics I want to see, and that feels like a tidy trifecta. But when I'm evaluating models, pass@1 doesn't always tell me enough about performance (if only it were that simple).
I also want to know how a model handles knowledge work outside software or the STEM fields most benchmarks are targeting. APEX Agents scores models on investment banking, management consulting and corporate law tasks written by people in those jobs. It's a great proxy for knowledge work since it evaluates high-stakes complex non-STEM domains where small failures can compound to detrimental outcomes.
Then there's the question of guardrails. AutomationBench fails a run if it reaches the goal by breaking rules it was told not to break. That's the low-level version of alignment I want: do what I asked, and nothing I didn't! I don't want to pay for tokens building tests just to pay a second time to cheat or revise a good test to pass on a bad result.
Another metric worth reviewing is Omniscience. Artificial Analysis Omniscience benchmark is a hallucination score with one detail I wish were everywhere: saying “I don't know”. It costs nothing and can save tons of time avoiding wrong paths! If I can't read every single line of process / reasoning the agent emits - I need to know it will stop when it doesn't have the answer and either (A) go research it, or (B) ask me about it. Otherwise a very capable model can produce solutions that technically pass the bar but do so in less than ideal, or unsatisfactory ways (a common example is choosing the wrong tool or approach as the "e;best"e; for a problem)
Another thing I check before paying attention to any plot: what's the variance? If the entire field is within a few points of each other, the flat line only tells you it's saturated. Ideally I want to see few if any scores close to 100%, none of these models are perfect or close to it, and the scoring should fall off a curve. That's where a plot is really conveying a choice that definitively changes outcomes. DeepSWE's time and steps columns pass that test easily: even similar scores cover a three-fold spread in time, or a five-fold spread in tool calls.
In IndyDevDan's video he sums it all up as "e;useful agent output per hour "e;, and I think that's a great synthesis. Time per task is really the denominator; cost and pass rate are a numerator, and we can combine those with the columns above as conditionals to check whether that numerator is genuinely "e;useful"e;.
In September, Specific Labs published Real-SWE, and I think it's worth reading alongside this. Its tasks come from private production codebases licensed from real companies, so none of that code is on the internet for a model to have seen. Eight models averaged a 26.9% resolution rate across eight rollouts per task. Most failures, the report says, came from reading someone else's system rather than writing code (the code has to make sense to you before you can fix it).
What caught my eye is that Real-SWE prints cost per rollout beside the score and splits the results by rollout length: under ten minutes, 70% of attempts failed; ten minutes or longer, 72%. There's time, reported directly! Longer runs buy almost nothing here, so I'm seeing the same problem on a harder task set. At least I now have two places to look for the time axis.
Real-SWE still scores each task on its own, with eight fresh runs apiece. For long-horizon work, I'd rather see a chain: the second task starts from whatever the agent left behind on the first (you inherit its earlier work too). Two benchmarks from this year do that. The first, ChainSWE, chains 304 real issues across 54 Python projects in chronological order, with dependent fixes in one shared codebase, and finds performance dropping by up to 70% as the chain gets longer. The second, SWE-Chain, works at release granularity: 155 version transitions across nine packages where each upgrade builds on the agent's prior codebase, and nine frontier configurations average 44.8% resolved.
That's where I'd look for a real answer to my Flash question. A model that uses five times the tool calls per task carries five times the residue into the next one, and that residue compounds along a chain. Neither abstract mentions time or cost per link, though. Give either chain those two columns and I know which board I'm reading first!
If you want to poke around, my site updates whenever the leaderboard does: deepswe-time.pages.dev. There's just one file in the source, and here's the issue that pointed me at the data in the first place: datacurve-ai/deep-swe#67.