DeepSWE — time: A Leaderboard With Wall-Clock as an Axis
Replotted the DeepSWE coding-agent leaderboard to show wall-clock time per task alongside cost, output tokens and agent steps.
- ROLE
- Solo — design and engineering
- PERIOD
- 2026
- PARETO FRONTIERS
- 4
- STACK
- Static HTML, SVG, Cloudflare Pages
THE PROBLEM
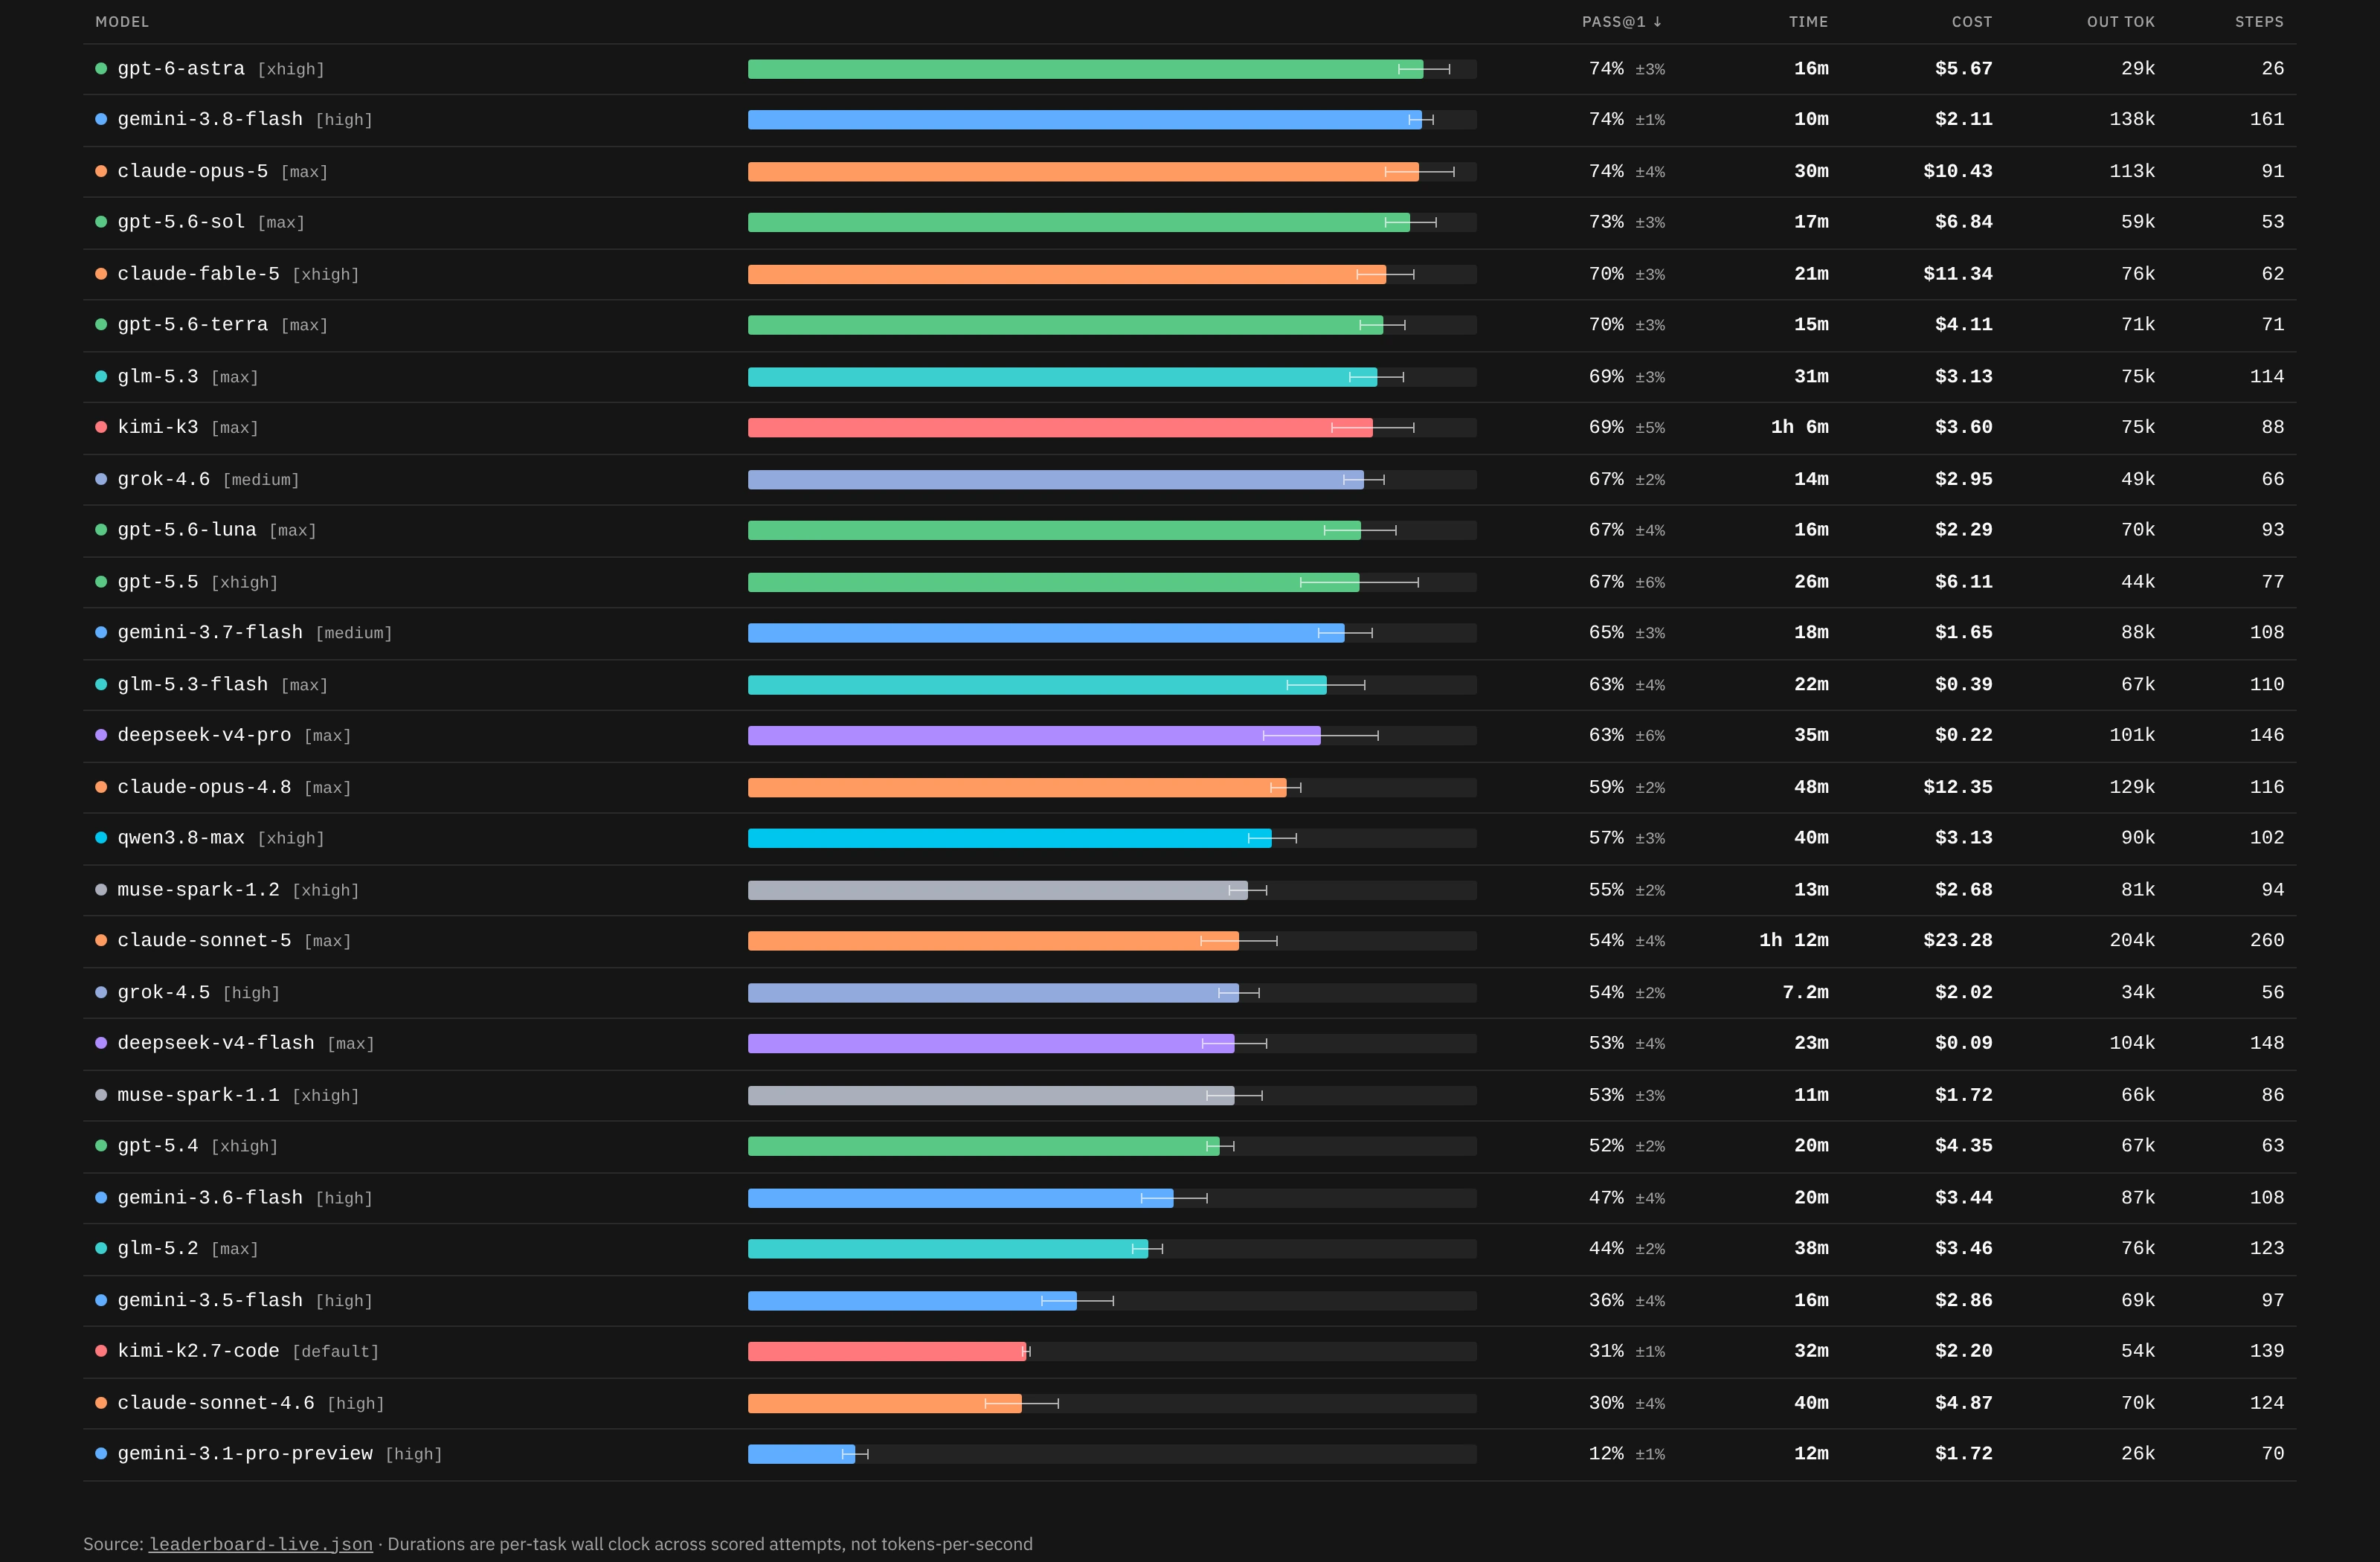
In Counting Agent Turns, I argued that dollars per task hides two costs: how many turns an agent takes and how long it runs. DeepSWE was the only leaderboard already charting that count. Its published artifact also had per-task duration, but nobody had plotted it.
WHAT I BUILT
- Fetches the official leaderboard JSON when the page loads. Every source update appears without a rebuild.
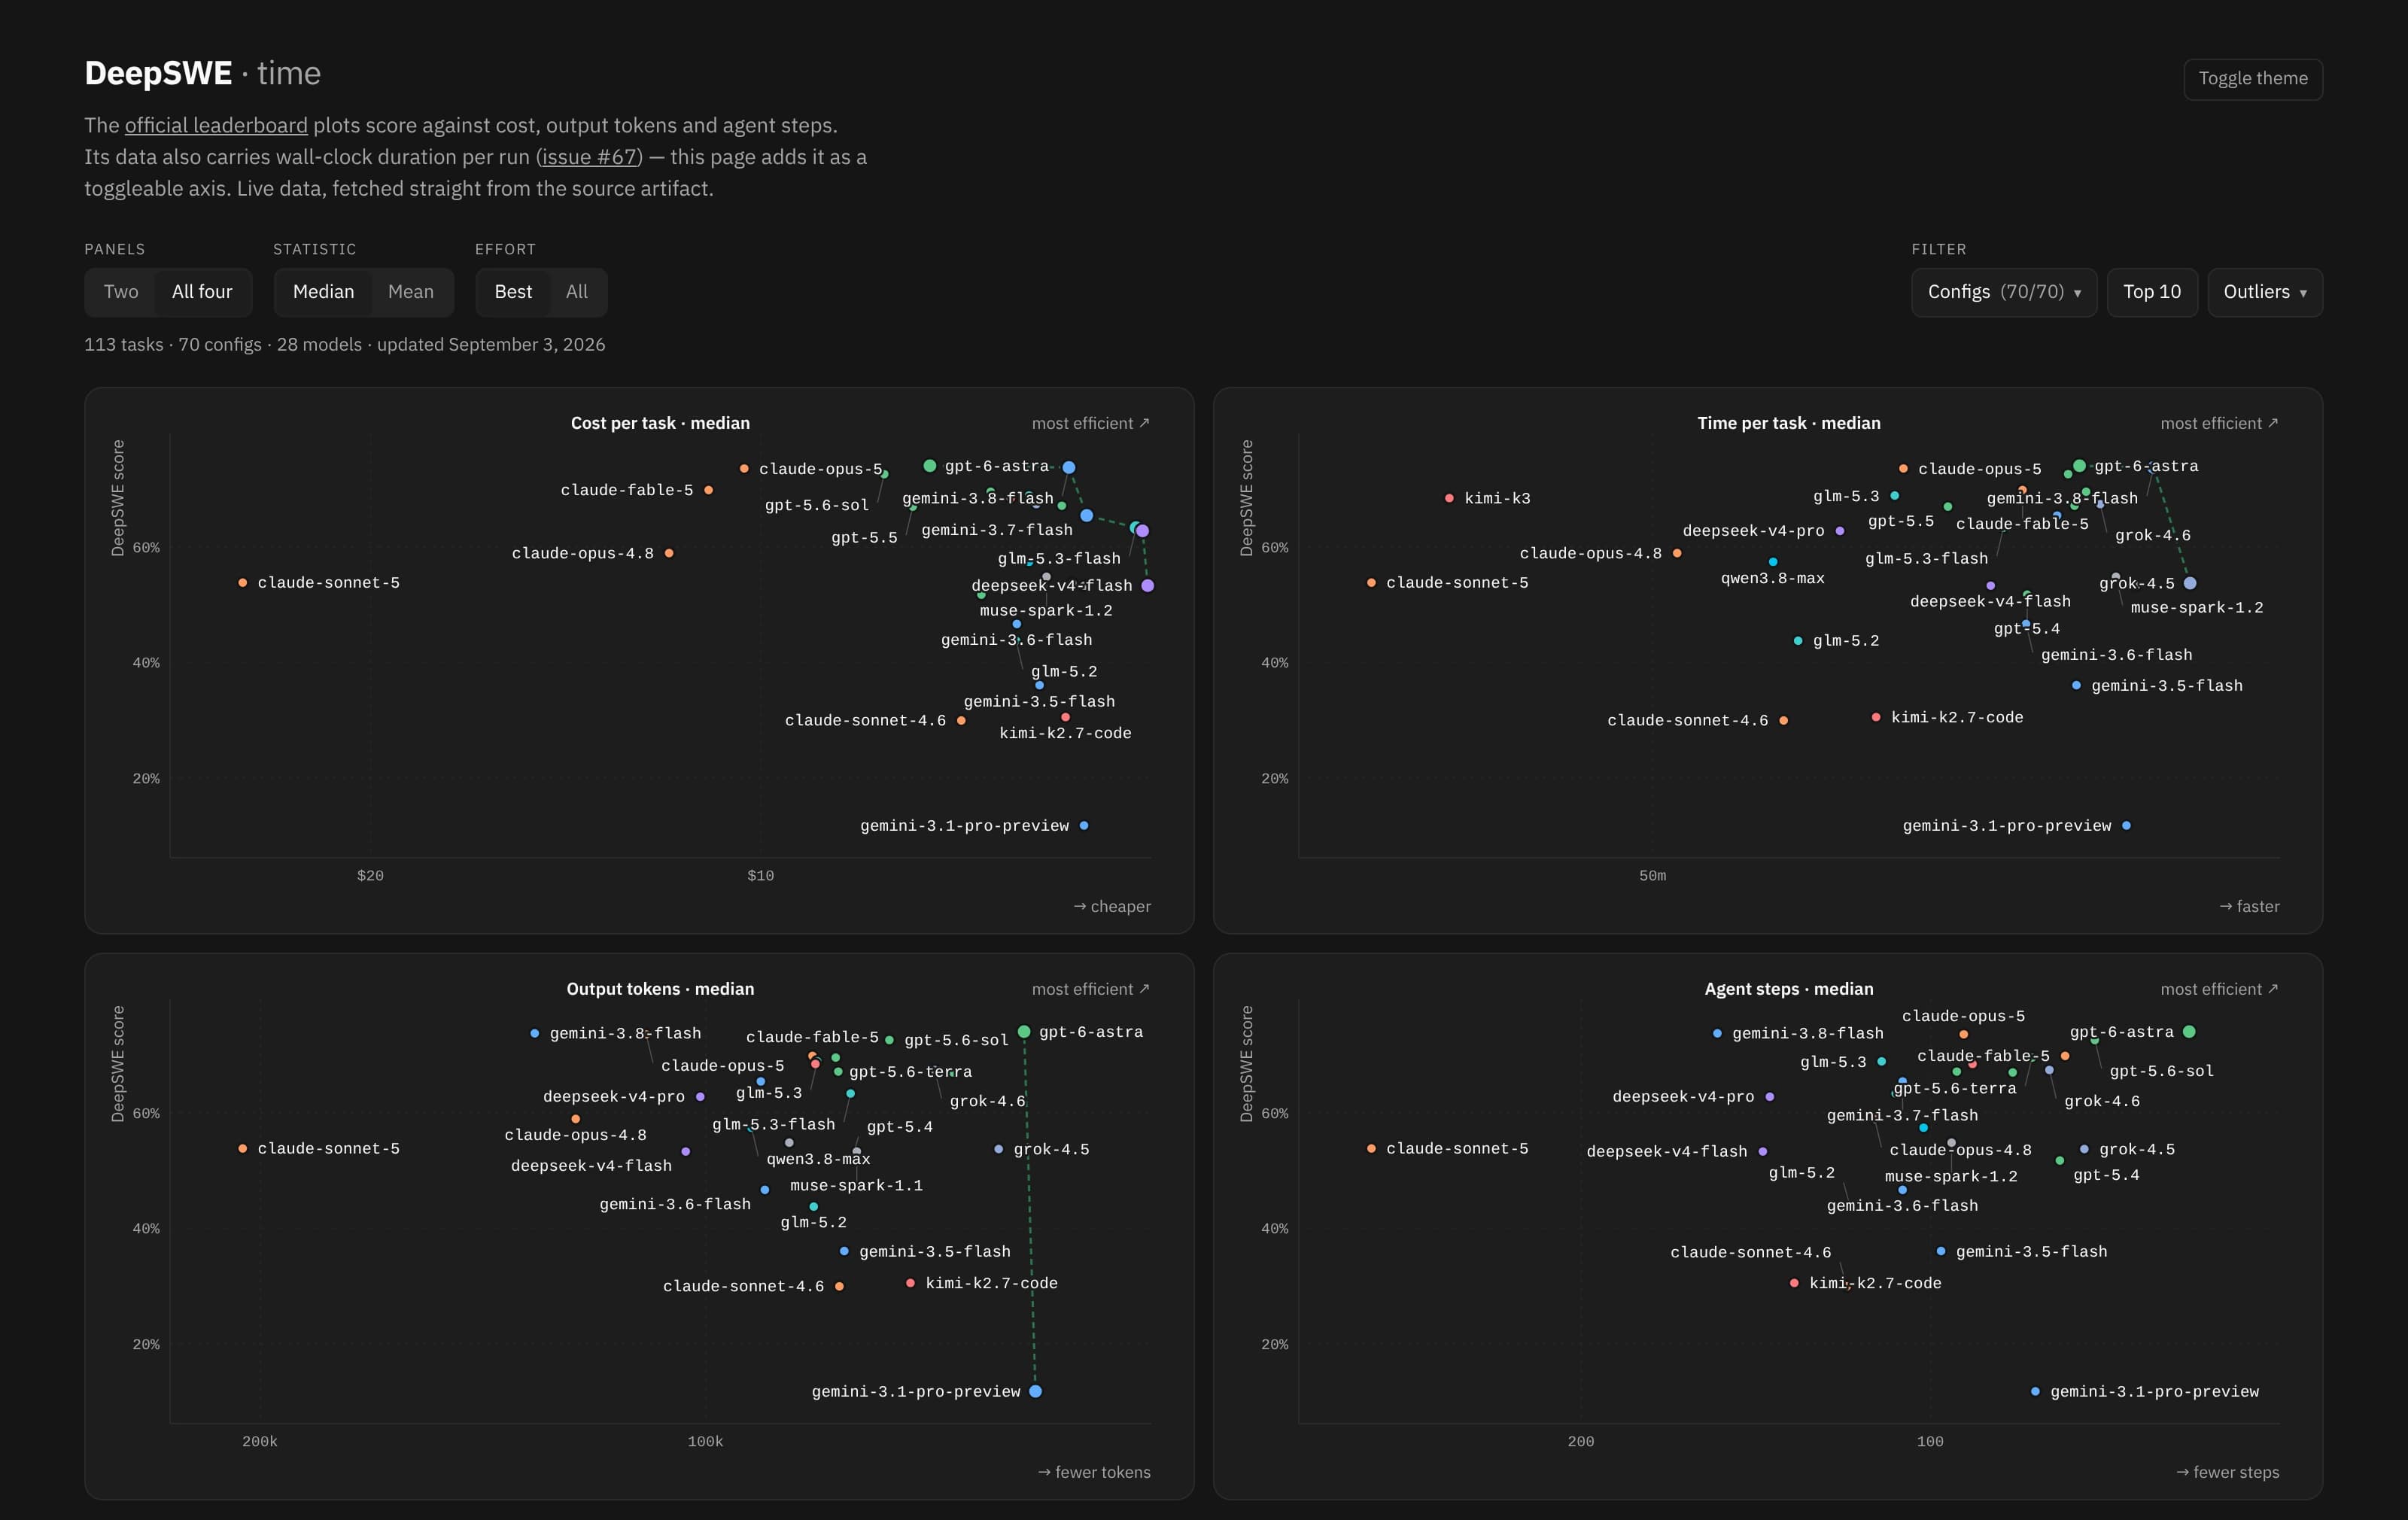
- Plotted pass rate against time, cost, output tokens and agent steps. Show two panels or all four, each with a Pareto frontier for its pair of axes. The page explains that each frontier applies only to its own panel.
- Added toggles for median or mean per task, best effort level or all effort levels, and top ten or the full field. Every panel shows the same configs. Hover over one to trace that model across the panels.
- Kept it to one HTML file with no build step or dependencies. Claude and Codex wrote the SVG charts to my spec, and the whole thing is still readable in one sitting.
OUTCOME
- Built the chart I called for in the post: time, turns and cost on one board, using one harness and one task set.
- The page reads the source artifact directly and stays current as long as the leaderboard does.
SCREENSHOTS