TideTime — Plan a Beach Trip Around the Tide
Turns NOAA tide predictions into an answer to "when should I go?", then hands you a calendar you can subscribe to.
- ROLE
- Solo — design and engineering
- PERIOD
- 2026 – Present
- LIGHTHOUSE PERFORMANCE
- 99
- STACK
- Next.js, TypeScript, Leaflet, uPlot, NOAA API, iCalendar
THE PROBLEM
NOAA publishes public tide data, and it's unreadable if you aren't a tide person. You get a wall of times and heights against a datum nobody outside the field knows, with no notion of what you're trying to do. Someone who wants to take their kid tidepooling next weekend has to work out on their own which of those numbers is a low enough tide, at a reasonable hour, on a day they're free.
WHAT I BUILT
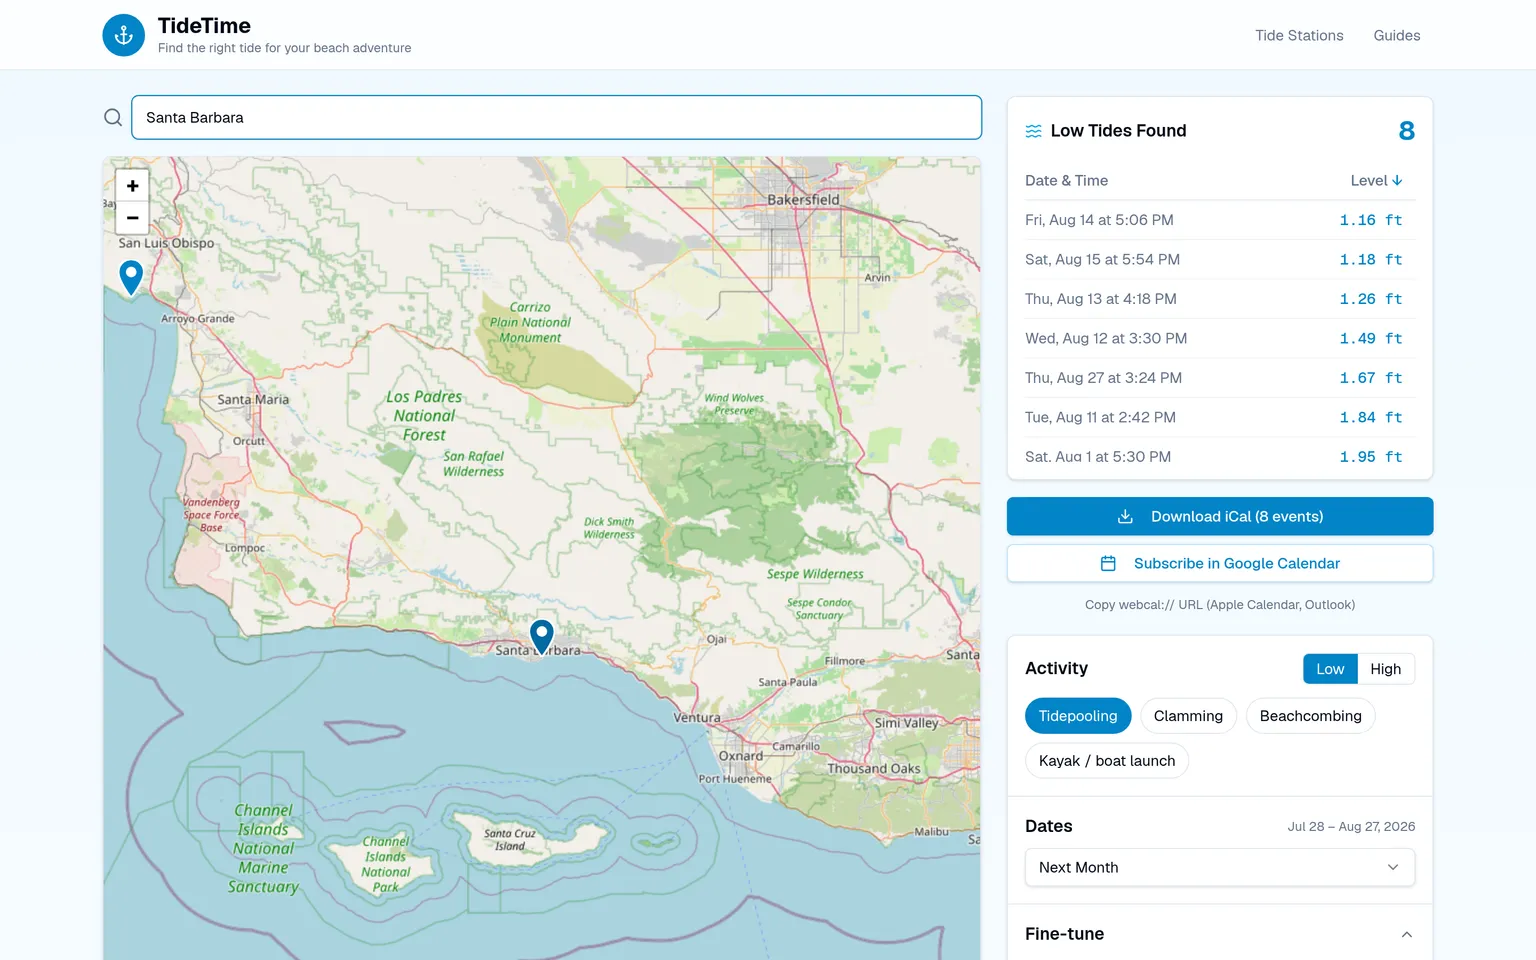
- Ask for an activity, not a datum. Pick tidepooling, clamming, beachcombing or a kayak launch and the height and time-of-day thresholds come with it. The custom controls are still there under Fine-tune for people who want them.
- Answer first. The qualifying windows are the loudest thing on the page; the map, the chart and the settings are all in service of them.
- Leave with a plan, not a screenshot. Download the windows as an .ics, subscribe in Google Calendar, or copy a webcal:// URL for Apple Calendar and Outlook.
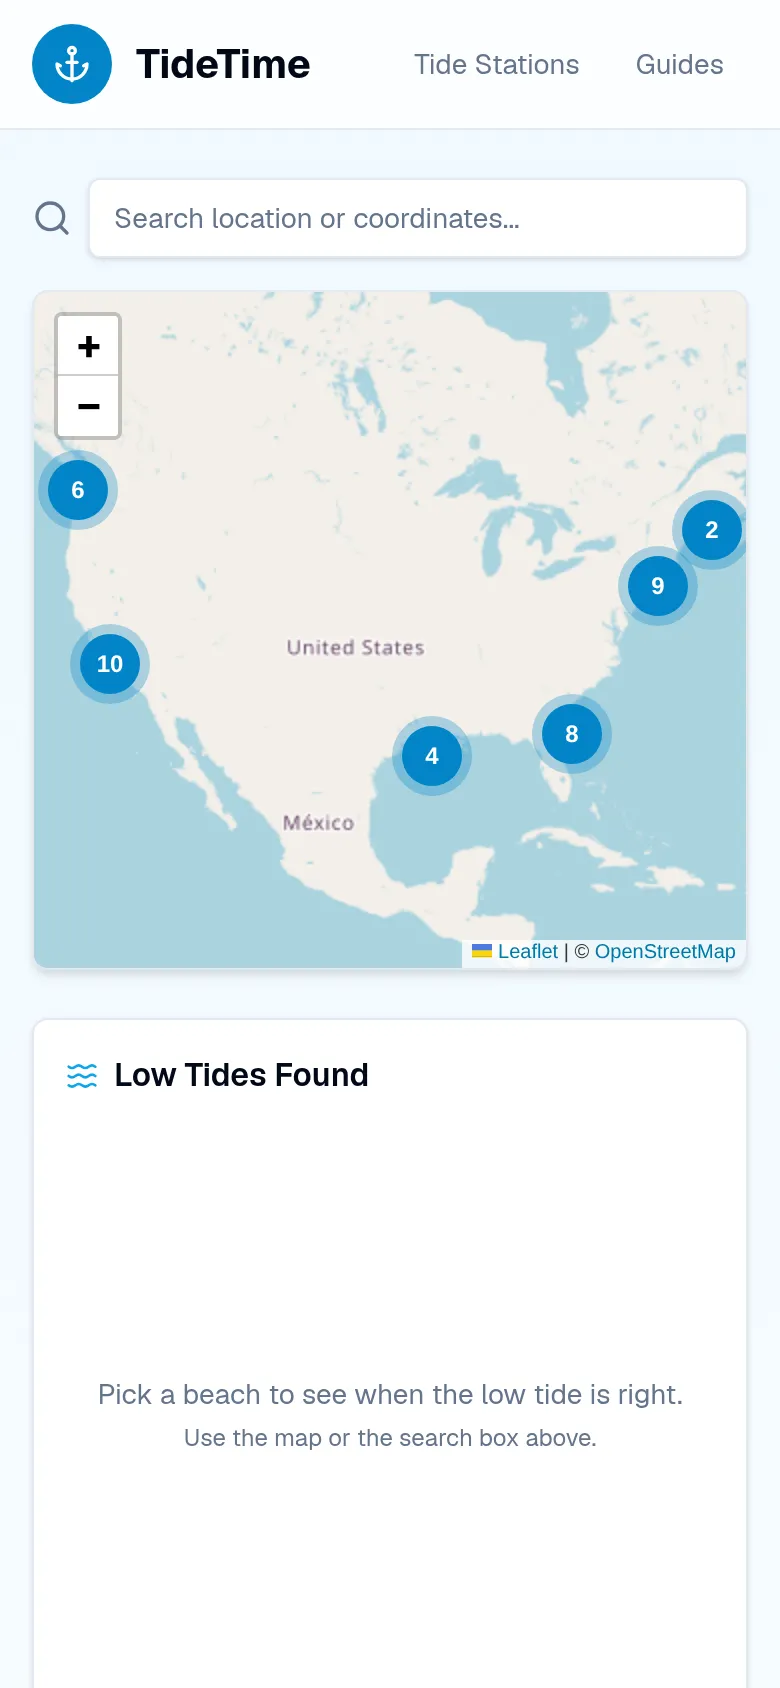
- Pick a spot from a clustered map of NOAA stations or by typing a place name. Coordinates work too.
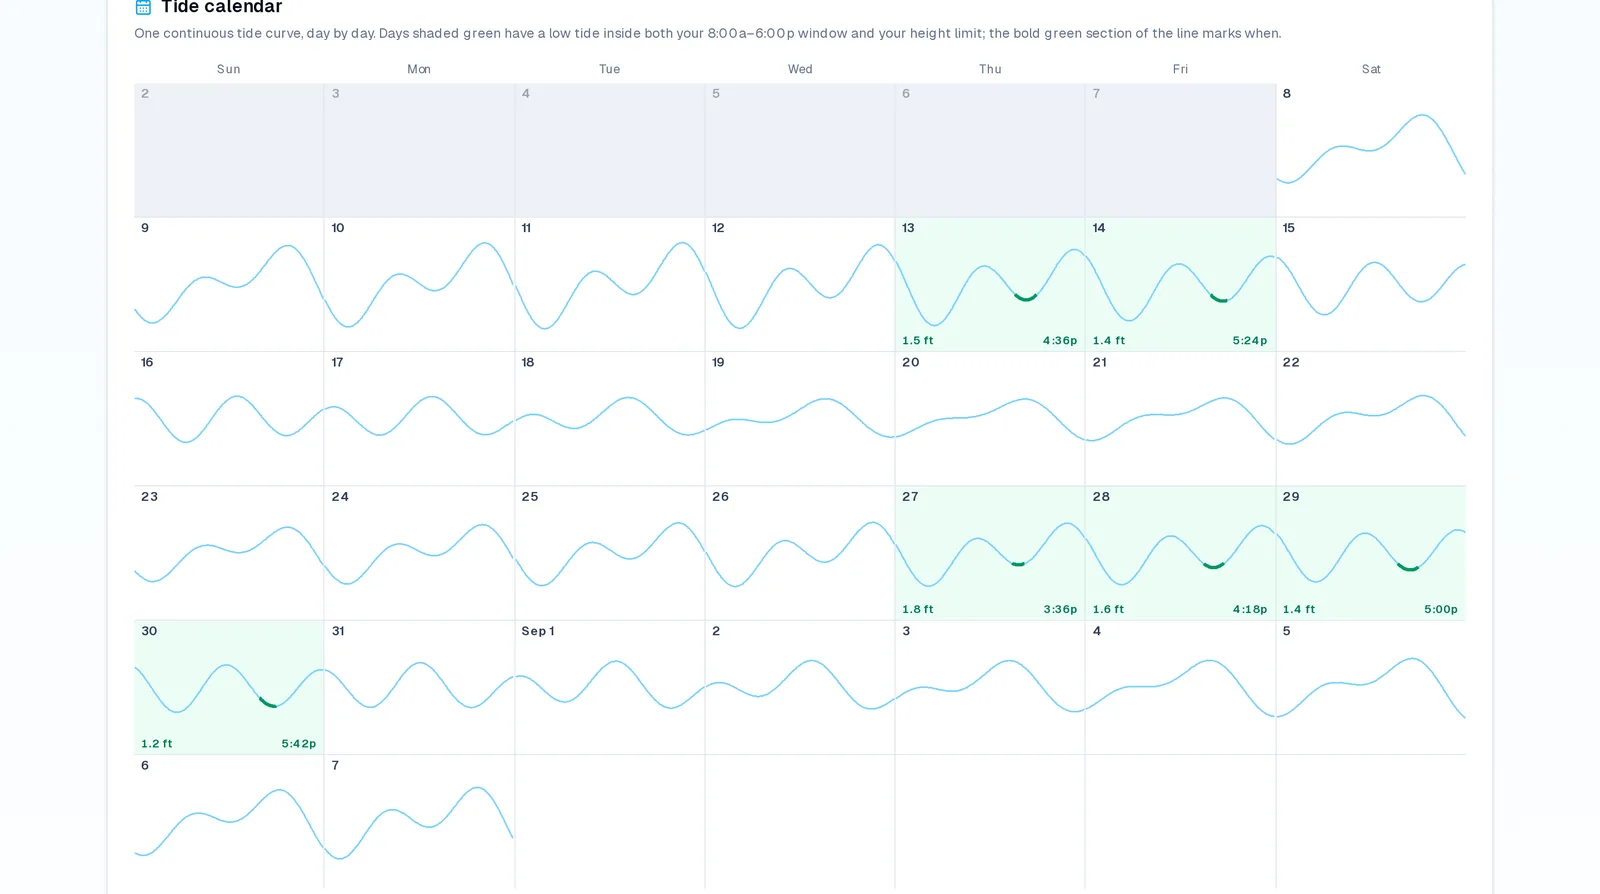
- Built for the phone first, since most of the real use is someone checking the night before, then given room to spread out into a month calendar on desktop.
OUTCOME
- Lighthouse 99 performance on desktop and 86 on mobile, with 100 on best practices and SEO.
- The whole loop is one page: pick a place, pick an activity, get windows, take them with you.
- Free public tide data made usable by people who don't know what MLLW means.
SCREENSHOTS