Counting agent turns
Dollars per task is on every leaderboard, steps per task is on one of them, and wall-clock on another. Steps are a cost paid twice, once by the model's context and once by yours, and none of these numbers says what state the work was left in.
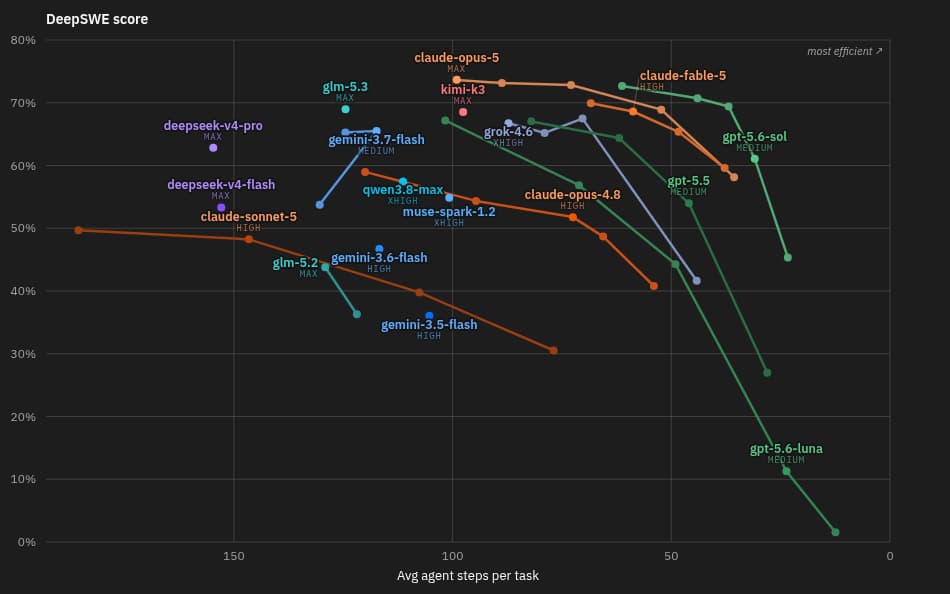
Almost every other leaderboard I read puts dollars on that horizontal axis. Turns ask a different question. Not what the task cost, but how much of the afternoon it took, and how much context the model and the person who asked for it still had by the end.
The lines are the part worth staring at. Each one is a single model at max, xhigh, high and medium effort, and they are not parallel. Dropping effort on claude-fable-5 or gpt-5.6-sol buys a large reduction in turns for a few points of score, so those lines run almost flat into the efficient corner. Dropping it on gpt-5.6-luna falls off a cliff, from roughly two thirds down to almost nothing. claude-sonnet-5 at high effort is out on the far left at about 150 turns for a middling score, which is the expensive corner in every sense. One dot per model would have hidden all of that, and a dollar axis would have priced it rather than timed it.
This started as a comment on a Hacker News thread about the Qwen3.8 Max release, where a lot of people were making the case that the open-weight models do the job for a fraction of the price. They do, and the pace out of those labs deserves the enthusiasm it gets. What I could not find, in the thread or on the leaderboards being cited in it, was the axis above: how many turns the fraction buys you.
Cost per task has become standard, and that is genuinely good. ARC Prize plots score against dollars spent per task as a real Pareto frontier. Terminal-Bench reports accuracy and cost_usd. SWE-bench carries a cost field per entry and links full trajectories as artifacts. Artificial Analysis' coding agent index goes furthest: a composite over DeepSWE, Terminal-Bench 2.1 and SWE-Atlas-QnA, reported with cost, token usage split into input, cache and output, and average wall-clock runtime per task.
The aggregators do the same thing one level up. BenchLM tracks 400-odd models over 406 benchmarks, weights 27 of them into a single score, and sets price, context window and throughput next to it. Agentic work is 22% of that score, carried by Terminal-Bench 2.0, BrowseComp and OSWorld-Verified.
So the field agrees that capability alone is a bad headline and that efficiency belongs on the chart. Dollars became the efficiency axis. Where there is a time axis at all it is usually throughput, tokens per second, which is the time number least connected to when the work is done: a model twice as quick per token that needs three times as many turns is slower overall.
How many times the agent went round the loop is a different quantity again, and much harder to find. Terminal-Bench's columns are accuracy, agent, org, cost and date, with nothing about that. SWE-bench links trajectories but does not rank on their length. The number is in every one of those artifacts. It just does not reach the table.
DeepSWE is the exception I have found. The chart above is one toggle on that page, which will plot cost or output tokens on the same axis instead, and the steps sit in the table as a column too. Four rows of it, 113 tasks, snapshot of 20 August:
model            pass@1   steps   avg cost
claude-opus-5       74%      99     $11.84
gpt-5.6-sol         73%      61      $6.46
glm-5.3             69%     124      $3.99
kimi-k3             69%      98      $4.65
The top two are one point of pass rate apart, and one of them gets there in 61 turns against 99. The bottom two are tied at 69% within a dollar of each other, and one of them needs 26 more turns to do it. On a cost-only chart the third row is the obvious choice. Whether it is the one you want depends on something the cost column does not carry.
Artificial Analysis holds the other half of the picture, and it is worth being precise about what it has. Execution time there is average wall-clock runtime per task, explicitly including tool calls, file writes and shell steps rather than model latency alone, which is why a fast underlying model can still finish last. So both numbers are published. They are published on two different sites, neither ranks on them, and the aggregator that would put them side by side ranks on quality, price and context instead.
The one group treating time as a first-class axis is METR, whose 50%-task-completion time horizon asks how long a task a human would take is, at the point where the model succeeds half the time. Their headline, the horizon doubling roughly every seven months since 2019, is one of the few numbers in the field that describes a trend rather than a release. But note the axis: that is human task duration, an estimate of difficulty. It measures how hard the job was, not how long the agent spent on it.
Before the argument, the concession. A model that needs two to five times the turns of a frontier model still converts a ticket into a reviewable diff, unattended, for a few dollars, and that was not the baseline anyone had a few years ago. The praise those models get is not undue. Measured against 2020, arguing about a 2x difference is a luxury. It is a luxury worth having numbers for, because that loop repeats many times a day, and because the multiplier on turns is really two multipliers: tokens into the model's window, and minutes on the clock of the person who asked.
The model's half is counted in tokens, not minutes. In Context Rot, Chroma evaluated 18 models and found that performance degrades as input length grows even on trivially simple tasks, and that models do not use their context uniformly. A longer trajectory means more tool output, more failed attempts and more of the model's own prior reasoning in the window, so a run that takes three times the turns spends its final stretch in a state its own earlier work created.
That is per task, and tasks do not arrive one at a time. If a piece of work takes 120 steps, two of them take 240, and the second starts from a window the first already filled. Somewhere in there a compaction fires, which means the second task is reasoned about from a summary of the first rather than from the first. The prompt cache goes the same way: a cached prefix survives as long as the window is only appended to, and compaction is precisely the event that rewrites the prefix and throws it away. Cache entries also expire on a clock of their own, which is the one place the model's side is billed in minutes rather than tokens. The longer the run, the more likely you pay for both.
The other half is the one measured in minutes, and it never shows up in a measurement at all.
When you start a task, you are holding a large amount of context that exists nowhere else. The requirements are written down, so those are safe. The rest is not: the half-formed suspicion that the bug is really in the caller, the three edge cases you thought of while reading the ticket, the awareness that the module you are about to touch is the one someone complained about last month, the better API shape you noticed but did not write down because you were going to get to it in a minute.
That context has a half-life, and the half-life runs on wall-clock rather than on tokens or turn counts. Fifteen minutes and two hours are not the same interval, and the difference between them is where those items go missing.
I keep good notes. Knowledge graphs, a memory directory, per-project instructions, a handoff skill for long-running work. All of it helps and none of it catches everything. There are always ideas that were alive at step one and gone by the time the work comes back. I have ADHD, and impaired working memory is part of the diagnosis, so that drop-off is steeper for me than for most, but it is not unique to me: I have yet to meet anyone it does not happen to.
None of this is new, either. Before any of the current tooling existed, the case for a fast build and a fast test run was never really about the machine time saved. It was that a loop you can close in seconds lets you keep the whole problem in your head, and a loop that takes twenty minutes does not. An agent run is that same loop with a different engine in it: work that comes back in fifteen minutes is a conversation, and work that spans an afternoon is a handoff to yourself with the unwritten part missing. What changed is that the interval got long enough to matter again.
- Shorter runs mean more attempts against the same calendar. This is the obvious one.
- Shorter runs mean the engineer is still holding the unwritten context when the diff lands, so review is sharper and the follow-up idea gets tried instead of forgotten.
- Shorter runs mean less compaction, and a summarized window has already thrown away detail that a shorter run would still have had.
None of that is captured by pass@1, and none of it is captured by cost per task either. A model that is cheaper per task and slower per task is a different product from one that is more expensive and faster, and only one of those halves has a number attached.
Turns are the measurable oversight. The other one I keep running into is not measurable in the same way, and I think it costs more.
Every one of these benchmarks is quantitative in the same shape: how many items from a fixed corpus passed. That tells you the model arrived. It says nothing about the state it left behind, and the state it left behind is what the next pass has to start from.
This is easiest to see in code. A test can go green over a patch that duplicated a helper three files away, split one coherent module into four shallow ones, or widened a signature until every caller has to care about the new argument. Pass@1 scores that as a success, and it is one, once. The bill arrives on the next pass, when the surface to reason over is wider and more tangled than it was, and it arrives on the human reader at the same time. A harness that runs every task from a clean checkout cannot see this, because it never takes a second pass over its own output.
The same failure exists outside code, it is just harder to point at. A model that resolves an uncertainty by taking the likelier branch and then proceeds as though it were settled has produced a usable answer sitting on a bad foundation. Ask it to build on that answer and the false certainty is load-bearing. What I want instead is the boundary marked: notice where the evidence runs out, say so, and leave the next pass something checkable. Verbosity is a milder version of the same problem. Prose long enough that the point stops surviving the read has defeated the purpose of having been written, and nothing in a pass/fail score notices.
I do not have a clean way to measure this. The nearest thing I can think of is scoring successive passes instead of single ones: run task N+1 against the tree that task N left, and see whether the pass rate holds. That turns “does this stack” into a number, which is more than we have now.
Less than I assumed when I started drafting the comment, and most of what is left is extraction rather than new work, because the trajectory artifacts already carry it:
- The median and the spread, not the average. A model with a good median and a long tail of hundred-turn flails is a worse daily driver than its average suggests, and the average is exactly what hides that.
- Turns and wall-clock from one source. DeepSWE has the first, Artificial Analysis has the second, and reading them together means reconciling two harnesses and two task sets.
- One scaffold across models. Same harness, same tools, same retry policy, so that the comparison lands on the models rather than on the scaffolds.
- An aggregator that ranks on any of it. The frontier chart exists on one site and nowhere in the rankings people cite.
- Pass rate on a second pass over the first pass's output, for the part that neither cost nor turns can see.
The open-weight releases would look good on most of that, which is why it is odd that the case for them is still being made in forum comments and personal anecdote rather than on an axis. The axis exists. It is one toggle on one leaderboard.
Which leaves me roughly where the comment started, minus a few wrong assumptions. Does anyone know of another benchmark or aggregator that reports agent steps per task, or that plots them as a frontier the way DeepSWE does? Has anyone tried scoring the second pass, in code or anywhere else? I would rather be corrected than keep repeating that these numbers do not exist.